An introduction to Multi Router Traffic Grapher (MRTG): A Complete Guide for Sysadmins
Table of Contents
Introduction
Understanding FCAPS
MRTG Within the FCAPS Framework
What is MRTG?
MRTG Architecture and How It Works
Benefits and Limitations of MRTG
Modern Alternatives and Comparative Analysis
Installation Prerequisites
Installing MRTG on Linux (Production Approach)
Installing MRTG on Windows
Understanding MRTG Output and Graph Interpretation
MRTG HTML Output and Customisation
Integrating MRTG with Nagios
Integrating MRTG with Zabbix
Performance Tuning and Scaling MRTG
Security Considerations
Real-World Use Case
Conclusion
FAQs
Introduction
In modern IT environments, visibility is everything. Whether you are managing a small office network or operating infrastructure at enterprise scale, understanding how traffic flows across your network is critical for maintaining performance, ensuring reliability, and planning for future growth. Without proper monitoring, issues such as bandwidth saturation, unexpected traffic spikes, or gradual performance degradation can go unnoticed until they begin to impact users and business operations.
This is where network monitoring tools play a vital role. Among the many solutions available, Multi Router Traffic Grapher (MRTG) stands out as one of the earliest and most influential tools in the space. Despite being developed in the 1990s, MRTG continues to be widely used today due to its simplicity, stability, and low resource requirements. It introduced a straightforward yet powerful concept: polling network devices via SNMP and turning raw counter data into clear, time-based visual graphs.
MRTG’s enduring relevance lies not in flashy dashboards or modern interfaces, but in its reliability and transparency. It provides network engineers with a dependable way to observe bandwidth usage over time, identify trends, and make informed decisions about capacity and performance. For many professionals, MRTG also serves as an entry point into the broader world of network monitoring, helping build foundational knowledge of SNMP, traffic analysis, and performance management.
In this blog post, we will take a comprehensive and practical look at MRTG from a professional infrastructure perspective. We begin by placing MRTG within the FCAPS network management framework, explaining how it contributes to performance monitoring and operational visibility. From there, we explore how MRTG works internally, including its architecture, data collection methods, and graph generation process.
You will then learn how to install and configure MRTG on both Linux and Windows systems, with a focus on production-ready practices. We will examine the output MRTG generates, how to interpret its graphs effectively, and how to customise its HTML output for better usability. The guide also covers real-world integrations with tools like Nagios and Zabbix, showing how MRTG can complement broader monitoring ecosystems.
Finally, we will evaluate MRTG’s strengths and limitations in the context of modern infrastructure, compare it with newer monitoring platforms, and discuss where it still fits in today’s technology landscape.
By the end of this post, you will not only understand how to deploy MRTG, but also how to use it as part of a wider monitoring strategy— whether for learning, maintaining legacy systems, or supporting lightweight network visibility solutions.
Understanding FCAPS
The FCAPS model, defined by ISO, is a foundational framework for network management. It categorises operational responsibilities into five domains:
- F - Fault Management – Detecting and resolving network issues
- C - Configuration Management – Managing device configurations
- A - Accounting Management – Tracking usage and billing
- P - Performance Management – Monitoring system performance
- S - Security Management – Protecting infrastructure
In enterprise environments, such as ISPs, financial institutions, or cloud providers, these domains often overlap. For example, performance degradation (P) can trigger a fault alert (F), which then requires configuration changes (C).
MRTG Within the FCAPS Framework
MRTG sits firmly within Performance Management, but its influence extends further:
- Detects abnormal traffic patterns → supports Fault Management
- Provides historical data → aids capacity planning
- Offers visibility into usage → loosely supports Accounting
MRTG is not an alerting system, but it is often paired with one (e.g. Nagios) to complete the FCAPS model.
What is MRTG?
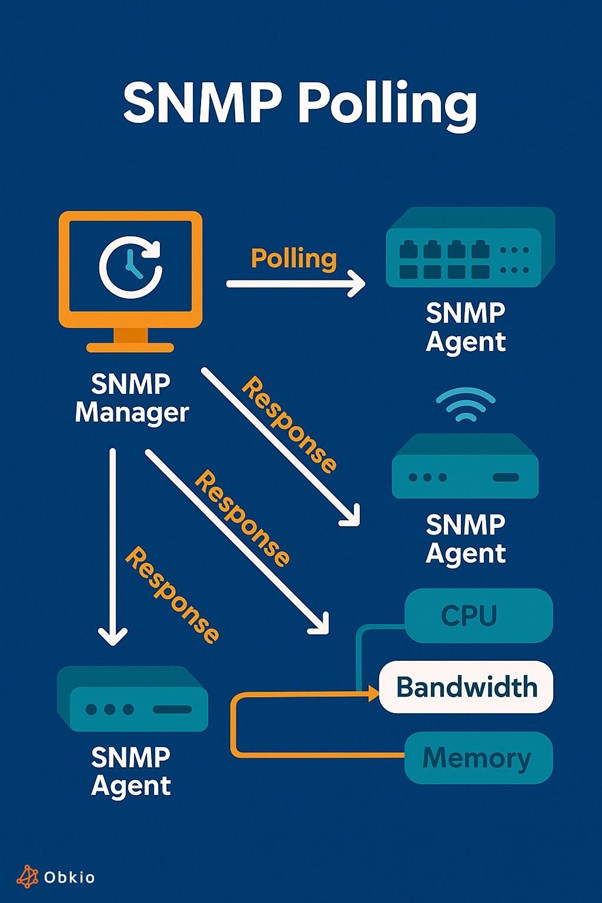
Multi Router Traffic Grapher (MRTG) is an open-source tool that monitors network traffic and visualises it using time-series graphs. It works by:
- Polling devices via SNMP
- Recording traffic counters
- Generating static HTML pages with graphs
MRTG is known for:
- Simplicity
- Stability
- Minimal resource usage
MRTG Architecture and How It Works
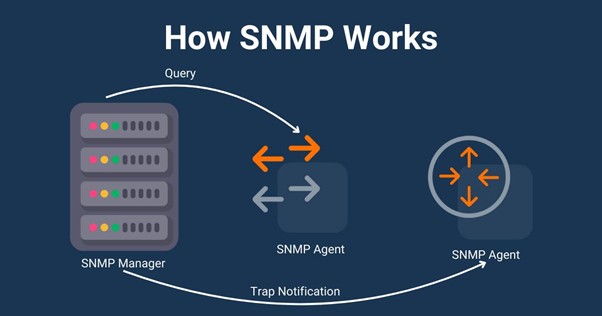
Understanding MRTG’s architecture is key to using it effectively. Below is a high level architecture for MRTG, followed by an overview of SNMP polling and finally, a diagram describing how SNMP works. The components used in the below images are:
- SNMP-enabled device such as routers, switches, servers exposing counters
- MRTG Poller, a Perl-based engine that queries SNMP OIDs
- Log Files that stores historical data (no database required)
- Graph Generator that creates PNG images
- Web Server that serves static HTML pages
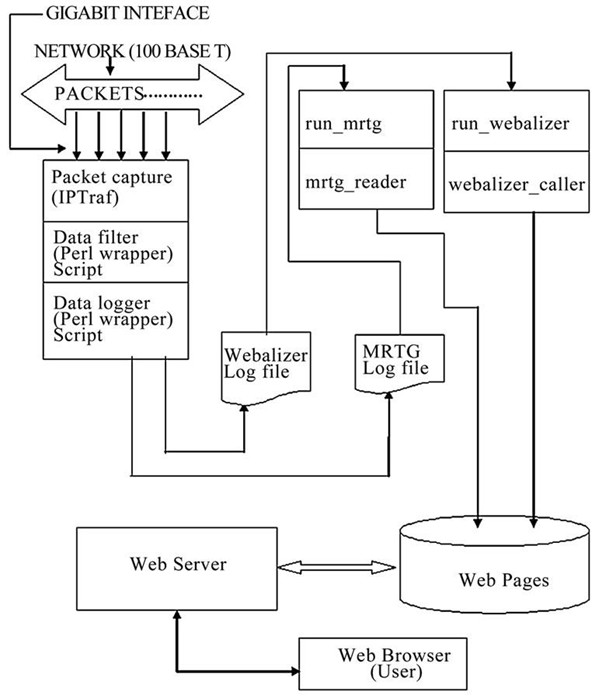
The data collection workflow for MRTG follows the below process:
- MRTG polls device every 5 minutes
- Reads inbound/outbound counters
- Calculates rate (bits per second)
- Stores results in .log files
- Generates updated graphs
- Updates HTML pages
There are two ways to keep track of traffic values within MRTG. MRTG primarily uses counters and calculates deltas, but gauges are available:
- Counter: Continuously increasing value (e.g., bytes transmitted)
- Gauge: Instant value (e.g., CPU usage)
Benefits and Limitations of MRTG
Benefits of MRTG include:
- Extremely lightweight
- No database dependency
- Simple deployment
- Predictable performance
- Long-term historical graphing
Limitations of MRTG include:
- Static HTML (no real-time dashboards)
- Limited alerting
- No auto-discovery
- Poor scalability at large scale
- Outdated UI
Modern Alternatives and Comparative Analysis
| Tool | Strength | Weakness | Best Use Case |
|---|---|---|---|
| MRTG | Lightweight | Static UI | Small/legacy networks |
| Cacti | Better UI | Still legacy | MRTG replacement |
| Zabbix | Full stack | Complex setup | Enterprise |
| Prometheus & Grafana | Scalable | Learning curve | Cloud native |
| LibreNMS | Auto discovery | Heavier | Medium/large networks |
Alternative modern tools provide the following:
- APIs
- Dynamic dashboards
- Alerting systems
- Auto-discovery
Installation Prerequisites
Before installing MRTG ensure that the following are installed:
- SNMP enabled (preferably SNMPv3)
- Web server (Apache/Nginx/IIS)
- Perl installed
- Network device access (check using snmpwalk)
Installing MRTG on Linux (Production Approach)
Start by installing the required packages:
sudo apt update
sudo apt install mrtg snmp snmpd apache2
Secure SNMP by using SNMPv3 where possible instead of SNMPv1/2c read only community "public".
Configure via /etc/snmp/snmpd.conf
Generate the MRTG configuration:
cfgmaker [email protected] > /etc/mrtg.cfg
Run MRTG
env LANG=C mrtg /etc/mrtg.cfg
Run MRTG multiple times to initialise the log files and then automate with Cron of the relevant system account
*/5 * * * * env LANG=C mrtg /etc/mrtg.cfg
Generate the MRTG index.html web page
indexmaker /etc/mrtg.cfg > /var/www/html/mrtg/index.html
Installing MRTG on Windows
Carry out the following steps to install MRTG on Windows:
- Install Strawberry Perl
- Install MRTG
- Enable SNMP service
- Generate config:
- Configure IIS to serve output
perl cfgmaker public@localhost > mrtg.cfg
perl mrtg mrtg.cfg
Understanding MRTG Output and Graph Interpretation
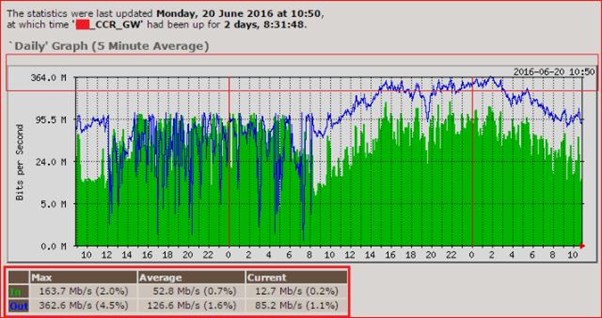
Each MRTG graph includes the following:
Carry out the following steps to install MRTG on Windows:
- Green – Incoming traffic
- Blue – Outgoing traffic
- Time ranges:
- Daily (5-minute average)
- Weekly
- Monthly
- Yearly
Interpreting the MRTG graphs can lead to actionable insights:
- Sharp spikes → Burst traffic
- Flat high usage → Saturation
- Gradual increase → Growth trend
As an example, such an insight could be that if usage consistently hits 90% then there is a need to upgrade the link capacity.
MRTG HTML Output and Customisation
Example MRTG HTML could look like the below:
<html>
<head>
<title>Network Traffic</title>
<style>
body { font-family: Arial; }
img { margin: 10px; }
</style>
</head>
<body>
<h1>Router Traffic</h1>
<img src="router-day.png">
<img src="router-week.png">
<img src="router-month.png">
<img src="router-year.png">
</body>
</html>
Customisation options for MRTG HTML include:
- Add CSS styling
- Embed into dashboards
- Use templates
- Add navigation menus
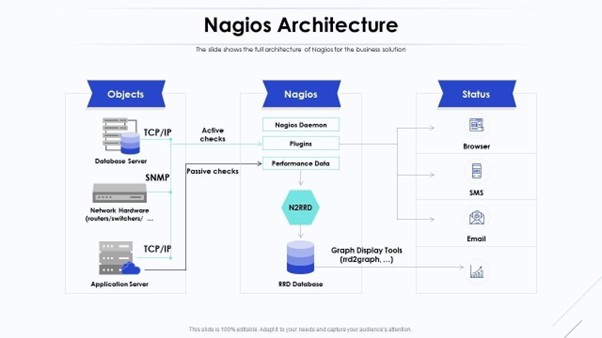
Integrating MRTG with Nagios
Below is a diagram depicting how MRTG can be integrated with Nagios. MRTG can be configured to use a RRD database and in this scenario, when performance data is fed into the database then Nagios is able to display it. As a result, Nagios provides the alerting capability whilst MRTG provides the performance data visualisation.
Alternatively, MRTG can be integrated into Nagios via simple direct HTML integration as shown below:
<div>
<h2>Bandwidth Usage</h2>
<a href="/mrtg/router.html">
<img src="/mrtg/router-day.png" width="500">
</a>
</div>
In both cases, it is the same process workflow:
- Nagios detects threshold breach
- Engineer clicks graph
- MRTG provides historical context
Integrating MRTG with Zabbix
The integration methods used to get MRTG and Zabbix to work together are the same as for MRTG and Nagios, namely:
- Embed MRTG graphs in dashboards
- Import data via scripts
- Use MRTG for legacy systems
An example MRTG HTML widget that can be used within a Zabbix dashboard could look like the below:
<div>
<h3>Traffic Overview</h3>
<img src="http://server/mrtg/router-day.png">
</div>
Performance Tuning and Scaling MRTG
Challenges include:
- Large configs slow execution
- Disk usage grows over time
- Polling delays
Optimisation Techniques:
- Split configs into multiple files
- Use faster disks (SSD)
- Reduce polling targets
- Use RRDtool integration
Security Considerations
- Avoid SNMPv1 and SNMPv2c “public” strings
- Use SNMPv3 authentication
- Restrict web access to MRTG pages
- Use firewall rules
Real-World Use Case
An example scenario: Branch Office Monitoring
- Router connected via 100 Mbps link
- MRTG monitors interface
Monitoring observations:
- Peak usage at 9am
- Saturation during backups
Resulting actions:
- Reschedule backups
- Upgrade link if needed
Conclusion
MRTG remains a powerful, lightweight monitoring tool despite its age. It excels in:
- Simplicity
- Reliability
- Historical visibility
However, modern environments demand:
- Scalability
- Automation
- Real-time monitoring
For these needs, tools like Zabbix or Prometheus are more suitable. MRTG is best used for:
- Small deployments
- Legacy systems
- Learning SNMP
FAQs
1: Is MRTG obsolete?
No, but it is largely replaced in modern environments.
2: Can MRTG monitor CPU or memory?
Yes, using SNMP OIDs.
3: Does MRTG support alerts?
Not natively.
4: Can it scale to large networks?
MRTG has limited scalability.
5: Is SNMPv3 supported?
Yes, and strongly recommended.